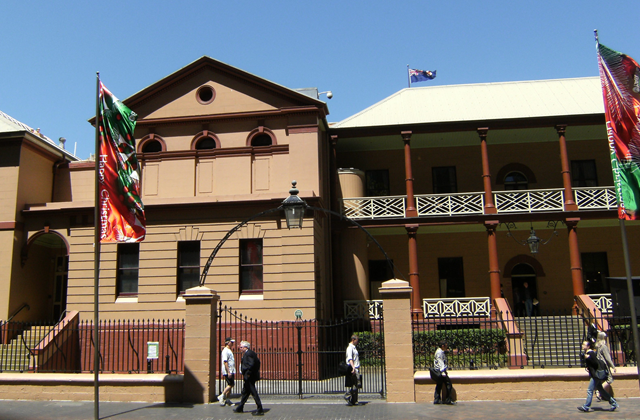
With approximately one week remaining until the NSW state election day on Saturday 28 March 2015, current polling data at the time of writing is favouring a return to power for the Liberal Party with Mike Baird as the leader.
Following a similar method used to forecast the 2013 Australian federal election, forecasts were made on a two party preferred (TPP) basis for the 2015 NSW state election. Based on statistically updating past district seats data (including any by-elections) for the Legislative Assembly with polling data current as at 20 March 2015.
As shown in the table below, of the 93 district seats, the Australian Labor Party is expected to win 17 seats (including both the Australian Labor Party and the Country Labor Party), the Coalition 70 seats (including both the Liberal Party and the National Party), and the other minor parties and independents collectively six seats. Implying that the Coalition is likely to win the state election overall; this is consistent with current polling results. On the basis of the forecasts, there are seven district seats which are reasonably too close to call. However, even factoring this in, the balance of probabilities still favours a Coalition win.
Potential sources of error are likely attributed to where the two preferred parties in an electoral district seat are not both of the two major parties. Additionally, effective from the 2015 state election, redistributions of electoral district boundaries in NSW occurred in 2013. Which also included abolishing seven of the districts (Burrinjuck, Marrickville, Menai, Murray-Darling, Murrumbidgee, Smithfield, and Toongabbie). Whilst some were essentially only renamed, the act of changing the district boundaries in general will add additional noise to the forecasts below. Furthermore a new district, Newtown, was created. With no incumbent party or past data specifically for the district, the forecast for Newtown is likely subject greater error than the others.
| Legislative Assembly – Two Party Preferred Forecasts | |||||
|---|---|---|---|---|---|
| District | Incumbent Party | Expected Proportion of Votes (TPP)* | Marginal Seat? | ||
| Labor | Coalition | Other | |||
| Albury | Liberal Party | 21.9% | 78.1% | ||
| Auburn | Australian Labor Party | 56.8% | 43.1% | ||
| Ballina | National Party | 23.5% | 76.4% | ||
| Balmain | The Greens | 48.2% | 51.7% | ||
| Bankstown | Australian Labor Party | 58.6% | 41.3% | ||
| Barwon | National Party | 17.0% | 83.0% | ||
| Bathurst | National Party | 25.0% | 75.0% | ||
| Baulkham Hills | Liberal Party | 22.4% | 77.6% | ||
| Bega | Liberal Party | 29.9% | 70.0% | ||
| Blacktown | Australian Labor Party | 52.0% | 48.0% | ||
| Blue Mountains | Liberal Party | 43.5% | 56.5% | ||
| Cabramatta | Australian Labor Party | 50.3% | 49.6% | Yes | |
| Camden | Liberal Party | 29.6% | 70.3% | ||
| Campbelltown | Liberal Party | 44.9% | 55.1% | ||
| Canterbury | Australian Labor Party | 56.7% | 43.2% | ||
| Castle Hill | Liberal Party | 18.1% | 81.8% | ||
| Cessnock | Country Labor Party | 52.7% | 47.3% | ||
| Charlestown | Australian Labor Party | 76.3% | 23.7% | ||
| Clarence | National Party | 31.5% | 68.5% | ||
| Coffs Harbour | National Party | 21.6% | 78.4% | ||
| Coogee | Liberal Party | 40.1% | 59.8% | ||
| Cootamundra | National Party | 17.8% | 82.1% | ||
| Cronulla | Liberal Party | 23.2% | 76.7% | ||
| Davidson | Liberal Party | 12.7% | 87.3% | ||
| Drummoyne | Liberal Party | 31.8% | 68.2% | ||
| Dubbo | National Party | 65.2% | 34.7% | ||
| East Hills | Liberal Party | 47.6% | 52.3% | ||
| Epping | Liberal Party | 23.5% | 76.4% | ||
| Fairfield | Australian Labor Party | 49.9% | 50.0% | Yes | |
| Gosford | Liberal Party | 36.5% | 63.5% | ||
| Goulburn | Liberal Party | 22.2% | 77.8% | ||
| Granville | Liberal Party | 45.6% | 54.4% | ||
| Hawkesbury | Liberal Party | 14.4% | 85.6% | ||
| Heathcote | Liberal Party | 35.5% | 64.5% | ||
| Heffron | Australian Labor Party | 70.2% | 29.8% | ||
| Holsworthy | Liberal Party | 24.3% | 75.7% | ||
| Hornsby | Liberal Party | 63.7% | 36.3% | ||
| Keira | Australian Labor Party | 52.2% | 47.8% | ||
| Kiama | Liberal Party | 40.8% | 59.1% | ||
| Kogarah | Australian Labor Party | 50.1% | 49.8% | Yes | |
| Ku-ring-gai | Liberal Party | 12.2% | 87.7% | ||
| Lake Macquarie | Independent | 36.7% | 63.3% | ||
| Lakemba | Australian Labor Party | 55.3% | 44.7% | ||
| Lane Cove | Liberal Party | 21.5% | 78.5% | ||
| Lismore | National Party | 24.4% | 75.6% | ||
| Liverpool | Australian Labor Party | 63.1% | 36.9% | ||
| Londonderry | Liberal Party | 36.1% | 63.9% | ||
| Macquarie Fields | Australian Labor Party | 49.7% | 50.2% | Yes | |
| Maitland | Liberal Party | 42.0% | 58.0% | ||
| Manly | Liberal Party | 16.6% | 83.4% | ||
| Maroubra | Australian Labor Party | 49.7% | 50.2% | Yes | |
| Miranda | Australian Labor Party | 53.6% | 46.4% | ||
| Monaro | National Party | 46.2% | 53.8% | ||
| Mount Druitt | Australian Labor Party | 55.0% | 45.0% | ||
| Mulgoa | Liberal Party | 36.4% | 63.6% | ||
| Murray | National Party | 21.6% | 78.4% | ||
| Myall Lakes | National Party | 20.2% | 79.7% | ||
| Newcastle | Australian Labor Party | 57.0% | 42.9% | ||
| Newtown | None | 47.5% | 52.4% | ||
| North Shore | Liberal Party | 18.6% | 81.3% | ||
| Northern Tablelands | National Party | 83.4% | 16.6% | ||
| Oatley | Liberal Party | 47.7% | 52.2% | ||
| Orange | National Party | 24.5% | 75.5% | ||
| Oxley | National Party | 19.8% | 80.2% | ||
| Parramatta | Liberal Party | 36.3% | 63.7% | ||
| Penrith | Liberal Party | 32.1% | 67.8% | ||
| Pittwater | Liberal Party | 14.6% | 85.4% | ||
| Port Macquarie | National Party | 58.1% | 41.8% | ||
| Port Stephens | Liberal Party | 36.0% | 64.0% | ||
| Prospect | Liberal Party | 43.5% | 56.5% | ||
| Riverstone | Liberal Party | 28.4% | 71.6% | ||
| Rockdale | Liberal Party | 44.8% | 55.2% | ||
| Ryde | Liberal Party | 23.0% | 76.9% | ||
| Seven Hills | Australian Labor Party | 48.4% | 51.5% | ||
| Shellharbour | Australian Labor Party | 56.9% | 43% | ||
| South Coast | Liberal Party | 28.2% | 71.8% | ||
| Strathfield | Liberal Party | 43.9% | 56.1% | ||
| Summer Hill | Australia Labor Party | 49.1% | 50.8% | Yes | |
| Swansea | Liberal Party | 47.1% | 52.8% | ||
| Sydney | Independent | 34.7% | 65.2% | ||
| Tamworth | National Party | 59.4% | 40.5% | ||
| Terrigal | Liberal Party | 24.6% | 75.4% | ||
| The Entrance | Liberal Party | 35.9% | 64.1% | ||
| Tweed | National Party | 26.9% | 73.0% | ||
| Upper Hunter | National Party | 25.3% | 74.6% | ||
| Vaucluse | Liberal Party | 17.6% | 82.4% | ||
| Wagga Wagga | Liberal Party | 21.0% | 78.9% | ||
| Wakehurst | Liberal Party | 18.4% | 81.5% | ||
| Wallsend | Australian Labor Party | 54.9% | 45.1% | ||
| Willoughby | Liberal Party | 18.1% | 81.8% | ||
| Wollondilly | Liberal Party | 33.7% | 66.2% | ||
| Wollongong | Australian Labor Party | 49.2% | 50.7% | Yes | |
| Wyong | Liberal Party | 45.7% | 54.3% | ||
| * Note TPP Proportions may not add to 100 percent due to rounding. | |||||
How the above forecasts pan out remains to be seen. In general they imply a swing away from Labor and towards the Liberals or other minor parties and independents.
As it is said though, a week is a lifetime in politics. So what happens between now and then will decide who is in, who is out, and who is forgotten about.
Feature Image Credit: Danausi
 uthinki Considered Opinion?


