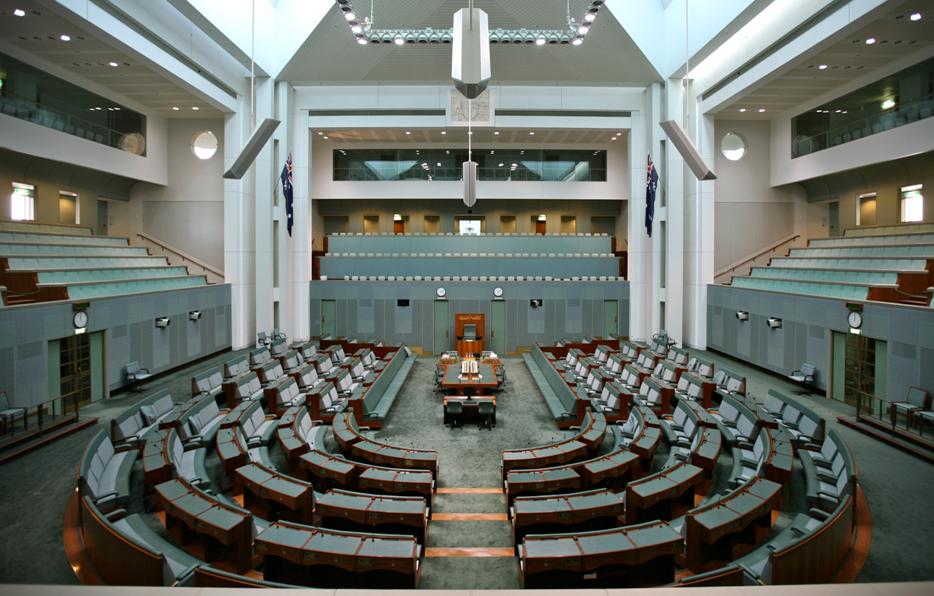
At this point, it’s now a little over the halfway mark in the campaign trail of the Australian federal election 2013. The general gist of things to this point, is that numerous polls are favouring the Coalition (Liberal) over Labor. From the table below, on the basis of the individual electorate seats for the House of Representatives, projections are suggesting that Labor is likely to win 60 seats, the Coalition win 85 seats, and the minor parties and independents collectively win five seats.
The results in the table below were calculated on a two party preferred (2PP) basis of the incumbent party from the 2010 Australian federal election, taking into account preferences and their nearest challenger, and statistically updated to reflect the sentiment of current polling results as at 22nd August 2013.
Whilst subject to error, like any forecast, especially where there are marginal seats, and with respect to any incumbent that is not in either of the two major parties given the current sentiment towards independents (plus some are retiring from politics) and the minor parties following the results – and the wheeling and dealings – of the 2010 election, it appears that the Coalition is set to win the 2013 Australian federal election. This is broadly consistent with the overall polls.
There are, however, the marginal seats where it’s realistically too close to call. With 10 of these forecasted, whilst they could make all the difference, the overall result still favours the Coalition gaining the balance of power.
| Electorate | Incumbent Party | Expected Proportion of Votes (2PP)* | Marginal Seat? | ||
|---|---|---|---|---|---|
| Labor | Coalition | Other | |||
| Adelaide (SA) | Australian Labor Party | 53.8% | 45.7% | ||
| Aston (VIC) | Liberal Party | 45.5% | 54.0% | ||
| Ballarat (VIC) | Australian Labor Party | 58.1% | 41.4% | ||
| Banks (NSW) | Australian Labor Party | 47.7% | 51.8% | ||
| Barker (SA) | Liberal Party | 33.6% | 66.0% | ||
| Barton (NSW) | Australian Labor Party | 53.2% | 46.3% | ||
| Bass (TAS) | Australian Labor Party | 53.0% | 46.5% | ||
| Batman (VIC) | Australian Labor Party | 54.1% | 45.4% | ||
| Bendigo (VIC) | Australian Labor Party | 55.7% | 43.8% | ||
| Bennelong (NSW) | Liberal Party | 43.2% | 56.3% | ||
| Berowra (NSW) | Liberal Party | 30.5% | 69.1% | ||
| Blair (QLD) | Australian Labor Party | 50.4% | 49.1% | Yes | |
| Blaxland (NSW) | Australian Labor Party | 58.6% | 40.9% | ||
| Bonner (QLD) | Liberal National Party | 43.5% | 56.0% | ||
| Boothby (SA) | Liberal Party | 45.6% | 53.9% | ||
| Bowman (QLD) | Liberal National Party | 36.1% | 63.5% | ||
| Braddon (TAS) | Australian Labor Party | 53.8% | 45.7% | ||
| Bradfield (NSW) | Liberal Party | 28.6% | 71.0% | ||
| Brand (WA) | Australian Labor Party | 49.5% | 50.0% | Yes | |
| Brisbane (QLD) | Liberal National Party | 45.1% | 54.4% | ||
| Bruce (VIC) | Australian Labor Party | 54.0% | 45.5% | ||
| Calare (NSW) | The Nationals | 35.8% | 63.8% | ||
| Calwell (VIC) | Australian Labor Party | 66.8% | 32.7% | ||
| Canberra (ACT) | Australian Labor Party | 55.4% | 44.1% | ||
| Canning (WA) | Liberal Party | 44.1% | 55.5% | ||
| Capricornia (QLD) | Australian Labor Party | 49.9% | 49.6% | Yes | |
| Casey (VIC) | Liberal Party | 44.4% | 55.2% | ||
| Charlton (NSW) | Australian Labor Party | 59.1% | 40.4% | ||
| Chifley (NSW) | Australian Labor Party | 58.7% | 40.8% | ||
| Chisholm (VIC) | Australian Labor Party | 52.1% | 47.5% | ||
| Cook (NSW) | Liberal Party | 33.8% | 65.7% | ||
| Corangamite (VIC) | Australian Labor Party | 46.5% | 53.0% | ||
| Corio (VIC) | Australian Labor Party | 59.9% | 39.6% | ||
| Cowan (WA) | Liberal Party | 40.0% | 59.5% | ||
| Cowper (NSW) | The Nationals | 37.1% | 62.4% | ||
| Cunningham (NSW) | Australian Labor Party | 59.6% | 39.9% | ||
| Curtin (WA) | Liberal Party | 30.5% | 69.1% | ||
| Dawson (QLD) | Liberal National Party | 43.9% | 55.7% | ||
| Deakin (VIC) | Australian Labor Party | 46.8% | 52.7% | ||
| Denison (TAS) | Independent | 45.0% | 54.5% | ||
| Dickson (QLD) | Liberal National Party | 41.2% | 58.3% | ||
| Dobell (NSW) | Australian Labor Party | 51.3% | 48.2% | ||
| Dunkley (VIC) | Liberal Party | 45.2% | 54.3% | ||
| Durack (WA) | Liberal Party | 32.9% | 66.7% | ||
| Eden-Monaro (NSW) | Liberal Party | 50.4% | 49.1% | Yes | |
| Fadden (QLD) | Liberal National Party | 32.4% | 67.2% | ||
| Fairfax (QLD) | Liberal National Party | 39.3% | 60.2% | ||
| Farrer (NSW) | Liberal Party | 32.1% | 67.4% | ||
| Fisher (QLD) | Liberal National Party | 42.2% | 57.3% | ||
| Flinders (VIC) | Liberal Party | 37.3% | 62.2% | ||
| Flynn (QLD) | Liberal National Party | 42.7% | 56.8% | ||
| Forde (QLD) | Liberal National Party | 44.6% | 54.9% | ||
| Forrest (WA) | Liberal Party | 37.7% | 61.8% | ||
| Fowler (NSW) | Australian Labor Party | 55.1% | 44.4% | ||
| Franklin (TAS) | Australian Labor Party | 57.2% | 42.4% | ||
| Fraser (ACT) | Australian Labor Party | 60.7% | 38.9% | ||
| Fremantle (WA) | Australian Labor Party | 52.0% | 47.6% | ||
| Gellibrand (VIC) | Australian Labor Party | 71.1% | 28.5% | ||
| Gilmore (NSW) | Liberal Party | 41.0% | 58.5% | ||
| Gippsland (VIC) | The Nationals | 35.0% | 64.6% | ||
| Goldstein (VIC) | Liberal Party | 40.3% | 59.2% | ||
| Gorton (VIC) | Australian Labor Party | 70.6% | 29.0% | ||
| Grayndler (NSW) | Australian Labor Party | 50.4% | 49.1% | Yes | |
| Greenway (NSW) | Australian Labor Party | 47.1% | 52.4% | ||
| Grey (SA) | Liberal Party | 35.3% | 64.3% | ||
| Griffith (QLD) | Australian Labor Party | 54.8% | 44.7% | ||
| Groom (QLD) | Liberal National Party | 28.3% | 71.3% | ||
| Hasluck (WA) | Liberal Party | 45.6% | 53.9% | ||
| Herbert (QLD) | Liberal National Party | 44.1% | 55.5% | ||
| Higgins (VIC) | Liberal Party | 40.9% | 58.6% | ||
| Hindmarsh (SA) | Australian Labor Party | 52.4% | 47.1% | ||
| Hinkler (QLD) | Liberal National Party | 36.1% | 63.5% | ||
| Holt (VIC) | Australian Labor Party | 60.5% | 39.1% | ||
| Hotham (VIC) | Australian Labor Party | 60.5% | 39.1% | ||
| Hughes (NSW) | Liberal Party | 41.1% | 58.4% | ||
| Hume (NSW) | Liberal Party | 37.7% | 61.8% | ||
| Hunter (NSW) | Australian Labor Party | 58.9% | 40.6% | ||
| Indi (VIC) | Liberal Party | 37.4% | 62.1% | ||
| Isaacs (VIC) | Australian Labor Party | 56.7% | 42.8% | ||
| Jagajaga (VIC) | Australian Labor Party | 57.5% | 42.1% | ||
| Kennedy (QLD) | Katter’s Australian Party | 34.6% | 64.9% | ||
| Kingsford Smith (NSW) | Australian Labor Party | 51.4% | 48.1% | ||
| Kingston (SA) | Australian Labor Party | 61.1% | 38.5% | ||
| Kooyong (VIC) | Liberal Party | 38.9% | 60.7% | ||
| La Trobe (VIC) | Australian Labor Party | 47.9% | 51.6% | ||
| Lalor (VIC) | Australian Labor Party | 69.0% | 30.6% | ||
| Leichhardt (QLD) | Liberal National Party | 41.7% | 57.8% | ||
| Lilley (QLD) | Australian Labor Party | 49.4% | 50.1% | Yes | |
| Lindsay (NSW) | Australian Labor Party | 47.3% | 52.2% | ||
| Lingiari (NT) | Australian Labor Party | 49.9% | 49.6% | Yes | |
| Longman (QLD) | Liberal National Party | 44.4% | 55.2% | ||
| Lyne (NSW) | Independent | 40.4% | 59.1% | ||
| Lyons (TAS) | Australian Labor Party | 58.7% | 40.8% | ||
| Macarthur (NSW) | Liberal Party | 43.3% | 56.2% | ||
| Mackellar (NSW) | Liberal Party | 31.0% | 68.6% | ||
| Macquarie (NSW) | Liberal Party | 44.9% | 54.6% | ||
| Makin (SA) | Australian Labor Party | 58.4% | 41.1% | ||
| Mallee (VIC) | The Nationals | 23.9% | 75.8% | ||
| Maranoa (QLD) | Liberal National Party | 24.2% | 75.4% | ||
| Maribyrnong (VIC) | Australian Labor Party | 64.1% | 35.4% | ||
| Mayo (SA) | Liberal Party | 39.1% | 60.5% | ||
| McEwen (VIC) | Australian Labor Party | 55.5% | 44.0% | ||
| McMahon (NSW) | Australian Labor Party | 54.1% | 45.4% | ||
| McMillan (VIC) | Liberal Party | 42.1% | 57.4% | ||
| McPherson (QLD) | Liberal National Party | 36.2% | 63.4% | ||
| Melbourne (VIC) | The Greens | 40.4% | 59.1% | ||
| Melbourne Ports (VIC) | Australian Labor Party | 54.2% | 45.3% | ||
| Menzies (VIC) | Liberal Party | 37.7% | 61.8% | ||
| Mitchell (NSW) | Liberal Party | 29.6% | 70.0% | ||
| Moncrieff (QLD) | Liberal National Party | 29.3% | 70.3% | ||
| Moore (WA) | Liberal Party | 35.3% | 64.3% | ||
| Moreton (QLD) | Australian Labor Party | 47.3% | 52.2% | ||
| Murray (VIC) | Liberal Party | 27.3% | 72.3% | ||
| New England (NSW) | Independent | 31.2% | 68.3% | ||
| Newcastle (NSW) | Australian Labor Party | 58.9% | 40.6% | ||
| North Sydney (NSW) | Liberal Party | 32.5% | 67.1% | ||
| O’Connor (WA) | Liberal Party | 24.1% | 75.5% | ||
| Oxley (QLD) | Australian Labor Party | 52.1% | 47.5% | ||
| Page (NSW) | Australian Labor Party | 50.4% | 49.1% | Yes | |
| Parkes (NSW) | The Nationals | 28.0% | 71.6% | ||
| Parramatta (NSW) | Australian Labor Party | 50.6% | 48.9% | Yes | |
| Paterson (NSW) | Liberal Party | 41.0% | 58.5% | ||
| Pearce (WA) | Liberal Party | 37.5% | 62.0% | ||
| Perth (WA) | Australian Labor Party | 52.2% | 47.4% | ||
| Petrie (QLD) | Australian Labor Party | 48.7% | 50.8% | ||
| Port Adelaide (SA) | Australian Labor Party | 67.7% | 31.9% | ||
| Rankin (QLD) | Australian Labor Party | 51.6% | 47.9% | ||
| Reid (NSW) | Australian Labor Party | 48.9% | 50.6% | Yes | |
| Richmond (NSW) | Australian Labor Party | 53.3% | 46.2% | ||
| Riverina (NSW) | The Nationals | 28.6% | 71.0% | ||
| Robertson (NSW) | Australian Labor Party | 47.2% | 52.3% | ||
| Ryan (QLD) | Liberal National Party | 39.2% | 60.4% | ||
| Scullin (VIC) | Australian Labor Party | 67.3% | 32.3% | ||
| Shortland (NSW) | Australian Labor Party | 59.3% | 40.2% | ||
| Solomon (NT) | Country Liberals | 44.5% | 55.1% | ||
| Stirling (WA) | Liberal Party | 40.7% | 58.8% | ||
| Sturt (SA) | Liberal Party | 42.7% | 56.8% | ||
| Swan (WA) | Liberal Party | 43.8% | 55.8% | ||
| Sydney (NSW) | Australian Labor Party | 63.7% | 35.9% | ||
| Tangney (WA) | Liberal Party | 34.2% | 65.3% | ||
| Throsby (NSW) | Australian Labor Party | 58.5% | 41.0% | ||
| Wakefield (SA) | Australian Labor Party | 56.8% | 42.7% | ||
| Wannon (VIC) | Liberal Party | 40.6% | 58.9% | ||
| Warringah (NSW) | Liberal Party | 33.5% | 66.1% | ||
| Watson (NSW) | Australian Labor Party | 55.4% | 44.1% | ||
| Wentworth (NSW) | Liberal Party | 31.7% | 67.8% | ||
| Werriwa (NSW) | Australian Labor Party | 53.1% | 46.4% | ||
| Wide Bay (QLD) | Liberal National Party | 31.1% | 68.5% | ||
| Wills (VIC) | Australian Labor Party | 70.5% | 29.1% | ||
| Wright (QLD) | Liberal National Party | 36.2% | 63.3% | ||
| *Note 2PP proportions will not add to 100 percent due to rounding. | |||||
Feature Image Credit: Alex Proimos
 uthinki Considered Opinion?


Pingback: Australian Federal Election 2013: Australia Decides()